A Perspective of Diamondbacks’ Rebuilt Offense
It’s likely the Diamondbacks will hit less home runs.
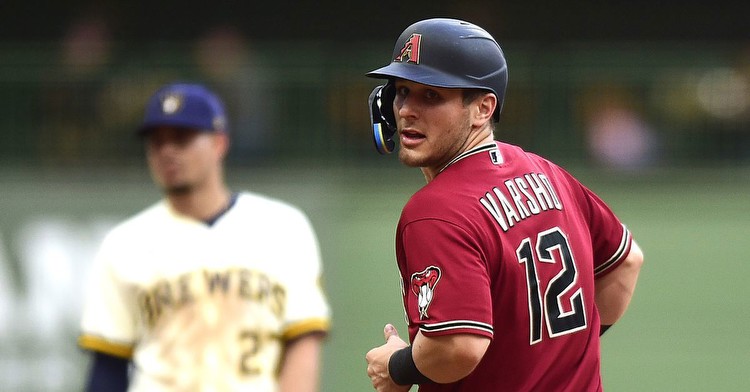
The Diamondbacks traded away Daulton Varsho, who hit 27 home runs and 74 RBIs last season (592 PAs), who ZiPS projected to hit 25 home runs and 73 RBIs this season (534 PAs).
The impact of the loss of Varsho will be about 9 home runs. Varsho’s 534 PAs projected by ZiPS will likely go to Pavin Smith and Corbin Carroll. Together they will hit about 13.5 home runs (based on HR/PA projected by ZiPS), and if catcher Gabriel Morena takes Herrera’s PAs, that will be an extra 2.7 home runs. The difference is about 9 home runs.
A new strategy is needed for scoring runs.
Instead of relying on home runs, the Diamondbacks could, as a team, focus on reaching the highest OBP possible. The great idea underlying this focus is that by increasing their OBP, the Diamondbacks will have more built innings (at least 5 batters reach base in an inning) and thereby win more games.
An explanation of built innings is in this AZ Snake Pit article.
The Diamondbacks have room to improve their team OBP. The following table shows that the Diamondbacks have the lowest OBP in the NL West. They rank 23rd in the Majors.
The good news is that ZiPS projections generally show the Diamondbacks’ players will have better OBPs. And my view is that the Diamondbacks will increase that further due to the following:
- Players who made their debuts last season will have bigger OBP gains.
- The great coaching staff will help players outperform their OBP projections.
What will be the Diamondbacks’ OBP next season?
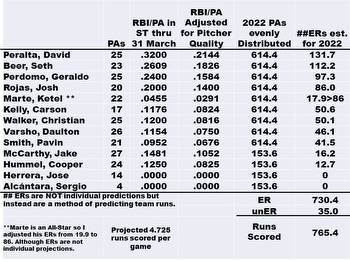
The first step is to project PAs. The following table shows ZiPS projected PAs and my projected PAs. It also shows the ZiPS projected OBPs(which will be needed for the second step).
The second step is to calculate the PA weighted average projected OBP for the team. That average OBP is .324466.
With the higher OBP, what are the odds of a built inning?
The probability that one inning becomes a built inning was calculated by considering each way of reaching a built inning and it’s probability.
There were three ways to reach a built inning.
The first possibility is that the first five 5 batters reach base.
Visualizing a single inning, looking at each batter, starting from the average projected OBP, what is the chance that 5 batters reach base (making the inning a built inning)?
There is only one way that can happen, five batters in a row reach base, The odds of that happening are OBP to the fifth power.
Calculation: One way multiplied by OBP to the fifth power which equals .003596.
The second possibility is that 5 of the first 6 batters reach base.
There are six possibilities. An example is the first batter does not reach base and the next five reach base. Another example is the first batter reaches base, the second batter does not reach base, and the last four reach base. However, when it’s the sixth batter who does not reach base, that situation was already accounted for as the first 5 batters reach base. Therefore there are 6 minus 1 equals 5 ways this can be happen.
Calculation: [6! / (6-1)!] minus 1 equals 5 ways
Calculation: 5 ways multiplied by (1 minus OBP) multiplied by OBP to the fifth power, which equals .012147.
The third possibility is that 5 of the first 7 batters reach base.
There are 42 possibilities, but 6 have already been accounted for. Therefore there are 42 minus 6 equals 36 ways this can happen.
Calculation: [7! / (7-2)!] minus 6 equals 36 ways
Calculation: 36 ways multiplied by (1-OBP) squared multiplied by OBP to the fifth power, which equals .05908.
So the total probability of an inning becoming built is the sum of the probabilities of the three possibilities, which equals .074823.
Knowing the probability of one inning becoming built, how many built innings will happen in games?
Let’s change our mindset to look at a nine inning game as a Bernoulli trial with each inning as an event, which can be either success (built inning) or fail (not a built inning).
Starting with the probability .074823 for success, the following table shows the probabilities for number of built innings in a nine inning game.
Based on projected built innings, how many wins are projected?
The first step is postulate the winning percent for each specific number of built innings in a nine inning game. Although I looked at historic data, instead I believe that the Diamondbacks will be significantly different this season. Therefore I postulated a mildly non-linear win probability distribution that has much similarity to the data in my article on built innings for the Diamondbacks. The biggest difference was for 3 built innings and 4 built innings in a game. If my postulated win probabilities are correct, it would mean that last season the Diamondbacks underperformed with 3 built innings (.433 vs .561 win%) and with 4 built innings (.586 vs .701 win %). Given the Diamondbacks poor pitching, that underperformance seems a reasonable possibility.
The following graph shows the postulated probability distribution.
Reasonable people can disagree. If you disagree with the postulated mildly non-linear win probability distribution, perhaps we can just agree to disagree. My intention is to look at this season’s results for the Diamondbacks to determine whether a different distribution would have more power.
The second step is to calculate projected win percent and number of wins for the season
Summary.
Instead of winning games by homers, it is realistically possible to win games by raising OBP to create more built innings. If the Diamondbacks reach .324466 OBP as projected, they could expect to reach 86.6 wins based on their built innings. Compared to last season, that 12.6 win improvement lends support to the idea that raising the Diamondbacks’ OBP can more than compensate for the lost home runs from trading away Daulton Varsho.