Gil Winston; Beyers and Trackmaster and reality
Beyers and Trackmaster and Reality
Frequently, you hear harness racing experts making assumptions on track bias based on the results of the first few races. “There were three consecutive wins on the front end. There is a definite speed bias today.” Or “Speed is collapsing, today. Bet the closers.”
This is usually nonsense. As with all other aspects of handicapping, you start off with your opinion. Did the horses who won on the front-end race to their form? Did the horses who should have closed based on the way the race was run, fail to close?
To consider the possibility of a track bias, there must be multiple horses who experienced a change in form. As a guide to consider whether there was a bias, review the charts when they are published. You will normally find that closers win more often when the last half is slower than the first half.
I would be remiss if I did not add that bias-based results are more frequent at some racetracks than others.
But what can we find in the charts that will help us calculate bias. It is all about the individual fractions. Those familiar with The Meadowlands know that some nights everyone is coming home in under :27 seconds while other nights find such closing fractions impossible. Yes, there is a way to properly evaluate fractions. Popular ratings guides in both thoroughbred and harness racing ignore the most important numbers.
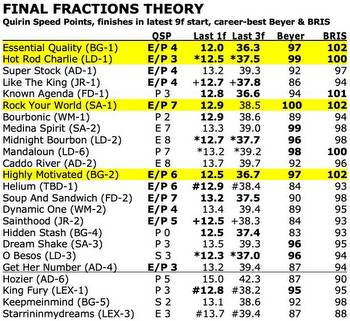
The flaws in Beyers thoroughbred ratings are obvious. First, individual fractions are not considered in the formula. The second glaring error does not apply to harness racing, but it needs to be pointed out. The weight carried by the jockey is applied to the formula without considering the distance of the race. For example, a two-pound swing in a mile and half race might be crucial, while a six-pound swing is totally irrelevant at five furlongs. Beyers factors in weight without considering distance.
In harness racing, we are more interested in the TrackMaster formula. I found the following analysis of TrackMaster via Microsoft Bing:
- First, gather all of the horse’s past performances with speed ratings within two years of its last race of any kind. Speed ratings are normalized race times that account for track, distance, surface, and other conditions. Speed ratings for races where the horse was less than 4 years old are adjusted using a special formula to account for age and maturity.
- Next, eliminate any races where the horse had a troubled trip, such as breaking stride, interference, or poor start. Also, eliminate any races that are more than 150 days apart from the date computed.
- Then, select the best 4 speed ratings from the remaining races. If there are less than 4 speed ratings available, use all of them.
- Finally, calculate the average of the selected speed ratings. This is the TrackMaster Horse Rating (THR) for the horse. The higher the THR, the better the horse’s overall ability.
Once again, individual fractions are not considered. In addition, we do not want to eliminate troubled trips. Those are major handicapping angles. For example, breaks can be major or skips. Sometimes breaks are uncharted interference breaks.
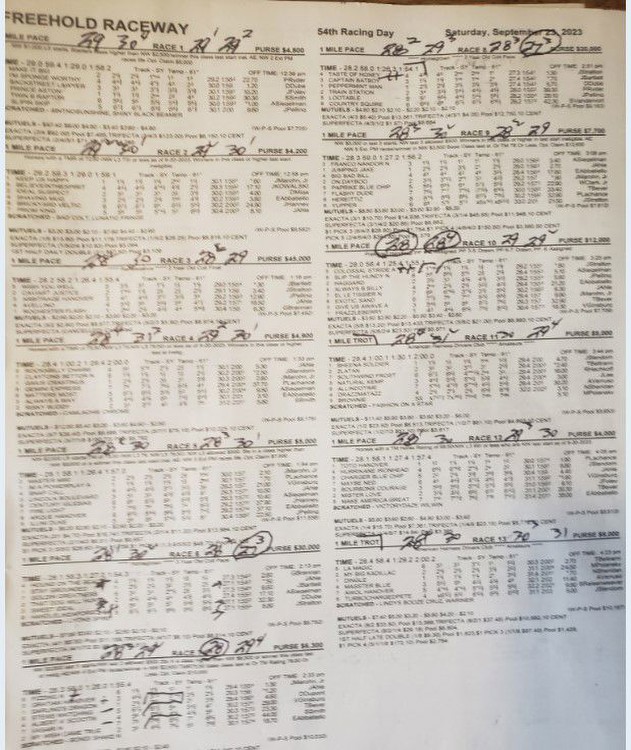
How do you define poor starts? This formula might disregard races after qualifiers. Not good. With the unfortunate factor that we do not have access to speed in sixteenths and eight of a mile bursts (requires watching) here is the definitive formula for calculating fractions that I use. As an example, here are the Freehold charts from 9/23/23 and the markings I place on them. I appreciate that it is difficult to make out the detail, but an explanation of the markings follow.
- Above each race, identify the individual quarter times, as opposed to the cumulative times provided by the chart.
- Identify trot races separately. On this card, there were only two trot races, so they are not factored in.
- Circle each fastest quarter of the day. On this chart, you can find the individual horse last quarter time. Find them. However, you need to dig into the chart to find the fastest horses in the second and third quarters. Based on the “one length equals 1/5 of a second guide,” highlight the actual fastest second and third quarters.
- I put plus signs next to the horses with the fastest individual quarters.
If a single number to highlight a horse’s ability is required for simplicity and to put on a program, this would be the formula:
- For each quarter, the horse with the fastest time gets a zero rating for that quarter. Add 1 for each fifth of a second slower than the fastest time.
- Add the score for each quarter and this would provide a more meaningful rating.
- The lower the score, the better.
While the numbers would be more accurate than Beyers or Trackmaster numbers, it also falls short of the complete handicapping exercise. On days where the spread of class is wide, you should factor that in. But that is not why this exercise is critical, and it is. When you are handicapping future races, and you note what appears to be a fast fraction in the past performances, you want to know how it compares to the day.
For example, on a card where races include open pacers and the symbolic “non-winners of a ham sandwich” event, you find one of the horses from a cheaper race backed through the field after a move only 2/5 of a second off the fractional time of a race multiple classes higher, this would most assuredly be considered for a future bet. First-over fractions are more powerful than covered-up fractions.
Handicapping is more art than science. But to ignore the mathematics, totally, is a huge mistake.
Power to the punter.
by Gil Winston, for Harnesslink