MLB Prop Bets: Washington Nationals @ Kansas City Royals
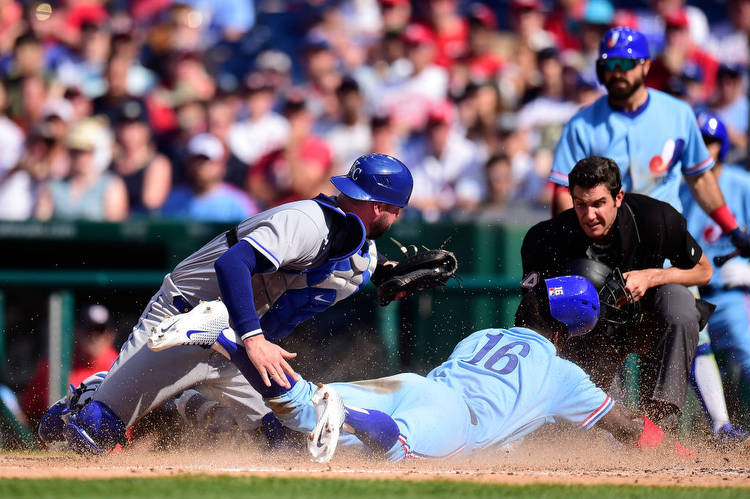
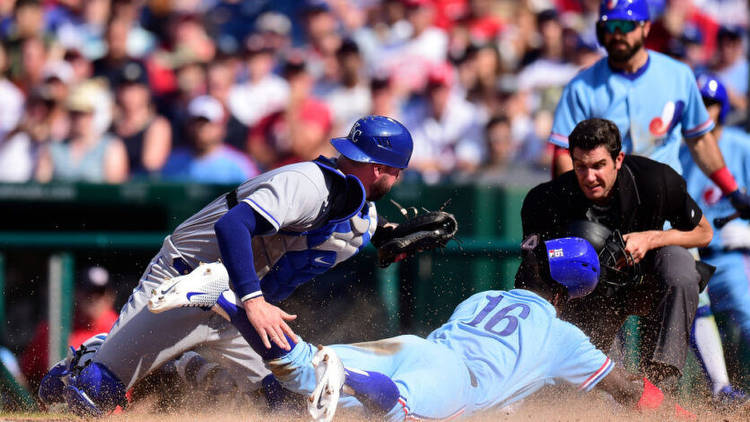
The Washington Nationals (21-29) face the Kansas City Royals (15-36) at Kauffman Stadium on Saturday at 10:10am. Let’s take a look at the MLB Prop Bets for the matchup. Patrick Corbin is the probable pitcher for the Nationals, while Jordan Lyles is the probable pitcher for the Royals. The Royals are favoured to win at $1.80, while the Nationals are at $2.07. The total runs line is set at 9.0, with OVER at $1.91 and UNDER at $1.94.
- The Nationals ($1.50) have a 31-19 Run Line record this season, while the Royals ($2.55) hold a record of 19-32.
- The Nationals have a 22-24-4 O/U record this season (meaning 22 games have gone over the total runs line, 24 have gone under and four have resulted in a push). The Royals have a 23-27-1 O/U record.
Scoring Insights
- The Nationals are averaging 4.2 runs per game this season (22nd in the league). Comparatively, the Royals are averaging 3.9 (26th).
- In the field, the Nationals are allowing 4.6 runs per game this season (19th in the league), while the Royals are allowing an average of 5.3 runs (28th).
Let’s take a look at how these teams perform in some other key statistical areas.
Batting Insights:
Batting Average
- Looking at their batting averages this season, the Nationals are at an impressive .265 (ranking 4th in the Major leagues), while the Royals are batting an underwhelming .229 (27th).
Home Runs
- In terms of total home runs this season, the Royals have hit 49 (T22nd in the Major Leagues). Meanwhile, the Nationals have managed 36 (29th).
Runs Batted In
- Finally, looking at their runs batted in, the Nationals have recorded 198 RBIs to rank 23rd in the MLB this season. Comparatively, the Royals have recorded 190 RBIs to rank T25th.
Pitching Insights:
Earned Run Average
- The Royals have an earned run average of 5.15 this season (29th in the Majors), while The Nationals have an ERA of 4.45 (21st).
Strikeouts
- Turning our attention to total strikeouts, the Nationals have recorded 366 this season, ranking 30th in the MLB. Meanwhile, the Royals rank T14th for total strikeouts, recording 434.
Opponent Batting Average
- Opponents are batting an average of .261 against the Royals this season (26th in the Major Leagues). Comparatively, the Nationals’ opponents are at .260 (25th).
First Innings Moneyline
- Here are their first innings moneyline records in 2023.
Lead After Three Innings
The Nationals are $2.50 to lead after three innings, while the Royals are $2.23.
- Here are their records after the first three innings in 2023.
NRFI/YRFI
The NRFI market is paying $2.04 and the YRFI is paying $1.78.
- The NRFI is 24-26 in Nationals games this season. The Royals have a 22-29 NRFI record.
Last Time They Met
The Nationals recorded a 5-2 victory over the Royals at Nationals Park when these teams last met on July 8, 2019. Brian Dozier went yard en route to that victory, hitting a home run to go with an RBI.

