Pitching in the deep: What FanGraphs’ new depth calculations mean for the Seattle Mariners’ playoff odds
We’ve just flipped the calendar to March, and Seattle Mariners fans know two things to be true: 1) The 2024 Mariners look better than last year’s squad. 2) The 2024 Mariners roster is laden with injury-prone players.
I don’t want to make the sloppy comparison that the team’s major additions this off season – The Mitches Garv ‘n Hanny, Luke Raley, Jorge Polanco – are the slightly dented cans found in the discount section of the grocery store. The ones with some cosmetic damage but intact innards, who are purchased for half of their shinier counterparts. But these players were strategic acquisitions for a front office who couldn’t pay the cover to even enter the club on Ohtani Night. It is, in my mind, the boldest (derogatory) (complimentary) off season Jerry Dipoto has had yet.
Well before pitchers and catchers reported, I’d already lost track of the number of times I’d uttered the phrase “…if he can stay healthy,” and earlier this week, per the Seattle Times, dominoes already seemed to be falling. The paragraph on Luis Urias was damning, and that was true even before they reported the would-be starting third baseman is projected to be on the injured list to start the season. And Pitching Ninja darling Matt Brash was “banged up” after his bullpen session and “didn’t provide many details but looked down at his elbow during the conversation,” a phrase which made me want to extract the ligaments from my own arm and mail them to Peoria.
So, like someone reeling from a breakup, I sought solace in the arms of that most steadfast and validating of companions: FanGraphs. Lo and behold yesterday, Ben Clemens published a piece titled “A New Way of Looking at Depth,” which is as (relatively) straightforward as its title would have you believe. Born out of a desire to continue improving the way FanGraphs’ playoff odds reflect reality, they struck on the concept of subtracting individual players and retooling team strength from there. In its current iteration, this isn’t so much a tool for assessing playoff odds as it is (for now) exploring a team’s depth and theoretical 162-game resiliency. I’ll let Ben explain the methodology in his own words:
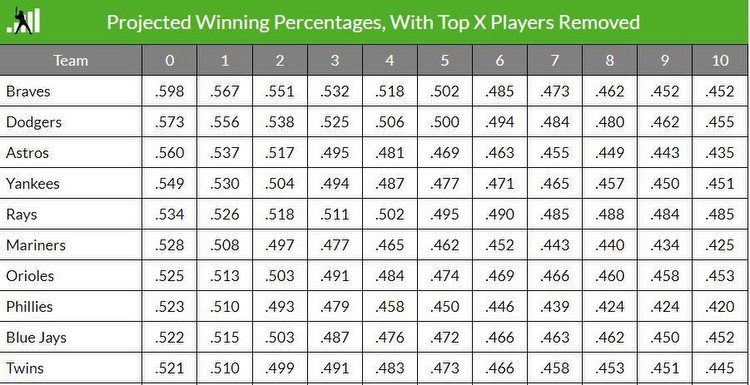
“The idea is to create a grid that shows how each team’s expected winning percentage changes as we remove the top players from the roster. First, we calculate the full-strength numbers against neutral opposition, which are what you can see on the projected standings page. Then we lop off the player with the most projected WAR and increase the plate appearances (or innings pitched) of the guys below that player on the depth chart to refill the team’s playing time.”
Now, math is not my strong suit (unless you ask my mother, who thinks I could be a mathematical genius and simply have been focusing on other things), so I’m not going to even begin to try to extrapolate on these calculations, but I do want to use this new tool to better contextualize a team who appears simultaneously deeply flawed and talented. Or, at the very least, to figure out where to direct my worries/idle 11:11 wishes.
Here is the overall chart, sorted simply by predicted winning percentage. I strongly encourage you to follow this link to Ben’s piece, where you can sort this table many times over to your heart’s content.
Because this is a volcano blog, and volcanoes famously love Seattle baseball teams, we’re going to specifically look at the Mariners within this. For reference, here are tables that show FanGraphs’ projections for both starting pitcher and position player fWAR (sorry, relievers, but we’re keeping you out of this).
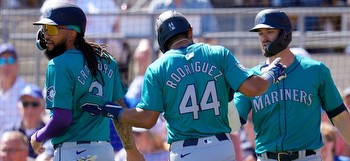
The M’s ten most valuable players, in order, are predicted to be Julio Rodriguez, Luis Castillo, George Kirby, Cal Raleigh, J.P. Crawford, Logan Gilbert, Jorge Polanco, Ty France, Mitch Garver and Bryce Miller.
Overall, FanGraphs projects Seattle to net a .528 winning percentage – sixth best in all of baseball, and fourth-best in the American League. Remove Julio from the equation, and they drop down to .508. With the absence of Julio and Castillo, they only lose 11 percentage points, but tack on Kirby and they sink another 20.
Ben posits that the loss of three stars represents a more realistic number of injuries, and this is where the Mariners start to get into some trouble. With their three top players missing – Julio, Castillo and Kirby – their projected winning percentage dips to .477. It’s a -.051 change – only the Braves, Astros and Yankees experience a more significant shift to their odds.
It felt significant to me that of the Mariners’ top three players, two are starting pitchers. Out of curiosity, I looked at the top three projected players for the AL teams who represent the greatest barriers to the Mariners’ postseason pathway – the Astros, Rangers, Orioles, Rays, Blue Jays and Yankees (sorry not sorry to the AL Central). The Blue Jays, Rays and Orioles had one starting pitcher each within their top three, and the Red Sox, Yankees, Rangers and Astros were position players only. I expanded the search to each team’s top five and aside from the Rangers, whose top five are exclusively position players (why give money throw ball when mash ball work just as well?), each of these teams has just one starting pitcher in their top five.
We knew this starting rotation could be one of the best in baseball, but this exercise really laid bare just how dependent Seattle is on the success – and health – of their starting pitchers. Like so many other cases, in seeking to assuage my worries, this new information has simply reallocated them. Who cares about third base? If Urias can’t play there, perhaps he’s better served acting as Castillo’s personal porter/bodyguard to protect against any and all harm.
This new method is obviously not an infallible means of predicting how depth impacts outcome – it doesn’t factor in previous injury history or risk, nor can it calculate a player missing only a portion of the season and, as Ben points out, simply removing a team’s best players is far from an accurate reflection of reality. But this feels like a significant step towards beginning to measure the impacts of health and the value of spreading out vs concentrating a team’s talent, and it is, at the very least, a fun new roadside attraction on the ever-unspooling journey that is accurately predicting playoff odds.