Can the Oakland A’s Catch the ’62 Mets?
From entertainment to finance to sports, every category of human endeavor has its own benchmark for incompetence. There are a lot of candidates to this title in MLB, but one of the most common invocations for ineptitude is the 1962 Mets. Sure, you can find better examples of hilarious failure in the 19th century, such as the Wilmington Quicksteps, who folded while warming up for a game in 1884 when attendance was zero, with the players having to find their own way home from Delaware. You can find teams that won fewer games, like the Cleveland Spiders. But 19th-century baseball was essentially one step above a traveling medicine show, and by the time the 1962 Mets came into existence, MLB was a thoroughly professional league which would be recognizable by today’s fans.
An expansion team that year, the Mets started off losing their first nine games. Things only got slightly better from there: they finished with 120 losses, the most in modern MLB history. Over 60 years later, the A’s, after a 10–38 start, seem poised to become the new true north of failure. Through the first 48 games (as of Sunday’s games), this year’s Oakland squad is actually two games behind (or ahead of, depending on your point of view) the ’62 Mets, who won 12 of their first 48 games.
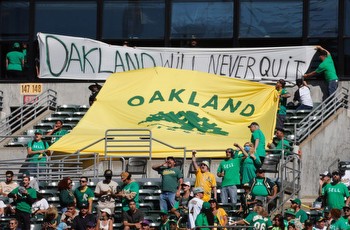
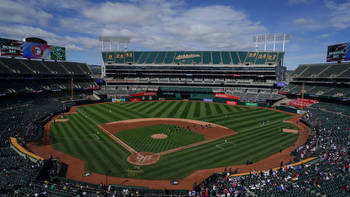
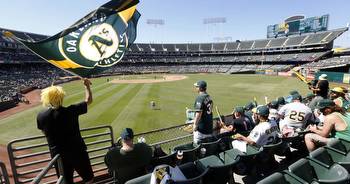
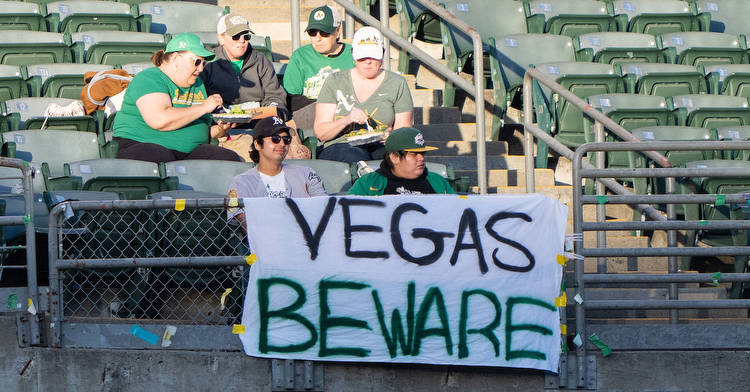
In some ways, the A’s are already a sadder case than the Mets are. The Mets were an expansion team, hampered by very miserly rules for the expansion draft which left them (and the Houston Colt .45s) with long roads to putting talented players on the field. By all accounts, the team was trying to win, and fan interest was high relative to the performance, with a million fans putting New York in the middle of the pack, attendance-wise. The A’s, on the other hand, are desperately trying to move to Las Vegas or whatever other city without baseball is willing to throw a billion dollars their way and are averaging under 9,000 paying fans — not attending fans — per game. The Mets may have had one of the worst first basemen in the league in “Marvelous” Marv Throneberry, but at least media didn’t have to evacuate an area because of possum urine. Combine the possums with a few dozen cats and whatever else is lurking, and the WhateverItsCalledThisYear Coliseum may be best described as an open-air wildlife refuge that sometimes has baseball games.
But what are the odds that the A’s lose 120 games or even more by the end of the 2023 season? To get an idea, I fired up the ZiPS projection system to get the latest tales of woe from the AL West.
As you might guess, Oakland’s playoff probability has a lot of zeroes to the right of the decimal before you get to a crooked number:
ZiPS Projected Standings – AL West (5/22)
The other four teams in the AL West all have paths to the playoffs, and the median projection has the A’s finishing a healthy 30 games behind whatever team finishes in fourth place. But that’s only 109 losses, a far less successful failure than the Mets’ 120.
Still, surely in these simulations, the A’s will lose 120 games sometimes. While 120-loss projections are generally not a thing in the preseason except on the long tail of the projected win curve, the A’s already being 10–38 gives them a better starting point than 0–0:
Worst 48-Game Starts Since 1901
The 1932 Red Sox got off to an even worse start than the A’s, but Oakland ranks quite highly on this list, tying with the 1988 Orioles, who notoriously started the season with a 21-game losing streak, something that nine-year-old me was quite aware of at the time (and they almost won the division in the Why Not? season next year!). I’m impressed with the 1987 Padres, who actually approached .500 over the rest of the season, going 54–60 to finish out the year. Incidentally, the worst start by a playoff team was the 17–31 2005 Astros who got swept by the White Sox in the World Series.
To get Oakland’s probability of beating the Mets, I ran the ZiPS simulation 50 times overnight, generating 50 million seasons (I normally only do a million seasons, but I wanted to catch those very extreme rare seasons in this exercise). And yes, the A’s lost at least 120 games relatively frequently, going all the way from a microscopic 28(!) wins to actually finishing with a .500 record. A lot of weird things happen in 50 million years.
ZiPS Final Oakland A’s Win Projections
Oakland lost at least 120 games in 5.2% of simulations and more than 120 games 3.6% of the time. The Mets only played in 161 games and had a tie; if we call that a .250 winning percentage (rather than counting the tie as a half-win and half-loss), the A’s are overall more incompetent in 2.5% of the simulated seasons, or about one-in-40. Those are slim chances, but not shocking — about the likelihood of a 15-homer hitter knocking out one in any given at-bat. Nobody had their minds blown by Xander Bogaerts or Jurickson Profar homering last year.
But the A’s have a secret weapon: the trade deadline. ZiPS can only evaluate the roster as currently constructed, but there’s at least some chance that Oakland sheds a few of its desirable players in the next couple of months, making the roster even worse. The A’s are unlikely to move performing players who are cost-controlled for a long time, but even if Ramón Laureano or Jace Peterson or Tony Kemp aren’t playing particularly well, they’re players who project to have value over the last two-thirds of the season. If the A’s can shed two wins worth of talent, which is something they’ve definitely shown they’re capable of doing, then all of the sudden, they’re looking at about a one-in-10 shot at 120 losses.
Given the situation in Oakland, it’s unlikely that these A’s will ever become lovable losers, as the ’62 Mets have become in baseball culture. But they do have a realistic chance of catching them in the standings.