In the NHL playoffs, what’s more valuable: Star power or depth?
It’s playoff time — would you rather have more strong players or fewer weak players? It’s the age-old question of what matters more in a playoff series: star power or depth.
In a sport like basketball, the answer is obvious. Star power rules all and the team with the best high-end talent usually wins. There are exceptions to the rule, but for the most part, the best teams are comprised of the league’s best players — players who can almost single-handedly take a team on a deep postseason run. Basketball is undoubtedly a strong-link game where games are mostly won and lost by the strongest players on the court.
Hockey is not as simple, at least it’s not viewed as such. The “ultimate team sport” often comes down to the best players doing their thing, but they’re also not on the ice as much as top basketball players. That means larger rosters and more room for depth pieces to play a larger role in the outcome — where a team is sometimes only as strong as its weakest link.
In hockey, going on a deep postseason run can sometimes be beyond the control of the league’s best players.
Sometimes. But not always.
Going back to 2010 there have been 195 playoff series played. The home team has won 54 percent of those series while the pre-series favorite (as judged by their GSVA) has won 63 percent of series. That’s the benchmark.
Simply having the best player in the series is obviously more helpful than not, but that information alone doesn’t do a great job of deciding who wins or loses a series. Since 2010, 56 percent of series have been won by the team with the best player (again, judged by their GSVA). That’s better than home-ice advantage, but not better than weighing the entire makeup of each team.
This sport is about more than one player. Even the best players need help. That much is obvious. The kind of help needed is what’s relevant though; is it more stars at the top of the lineup or fewer holes at the bottom of it?
Is a team as strong as its strongest links or as weak as its weakest links? That’s the big question in a sport where the answer isn’t obvious.
Hockey Graph’s Alex Novet tackled the topic six years ago and concluded that hockey is a strong link game, and that having the best players mattered more than not having the worst players. That study only looked at regular-season success and as we know the playoffs are an entirely different beast. It’s time for an update.
I went through each playoff series since 2010 and looked at how many skaters each team had above the 95th percentile. Then again for the 90th percentile and the 85th percentile all the way to the 65th percentile. That measures the amount of strong links each team has. Then I did the opposite to measure the amount of weak links. I looked at how many players each team had below the 50th percentile all the way down to the 20th percentile (which was equal in size to the number of players above the 95th percentile).
As it turns out hockey is also a strong link game in the playoffs where the odds of winning a series increase if a team has more star players — and are virtually unaffected by how many weak players a team has.
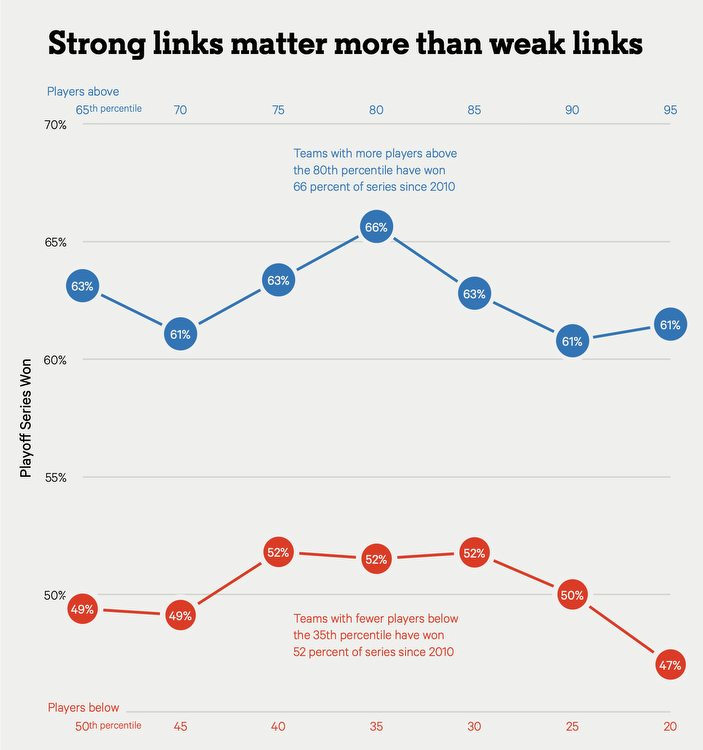
It doesn’t matter if we count which teams have fewer below-average players at the 50th percentile or fewer replacement-level players at the 20th percentile, the end result is the same. It’s a coin flip that gives us little valuable information. Those players do not decide playoff series — the stars do. It didn’t matter if the cast net was wide (players above the 65th percentile) or narrow (above the 95th percentile), the team with the most actual difference makers won more. And they won right in line with how often favorites have won over the last decade suggesting that whoever the favorite is in a series is often decided by the star players on it.
That’s not exactly ground-breaking stuff — “have more good players, thanks” — but the gap does show how trivial the bottom of the lineup really is. And how crucial the top of the lineup is.
In the playoffs, just like in the regular season, star power is a huge deal.
There’s a sweet spot in the chart above: the 80th percentile. The team that has more skaters in the league’s top 20 percent has won 66 percent of series since 2010 — a shade higher than looking at which team is favored. But we can go a step further.
Breaking things down by position reveals that forwards and defensemen have slightly differing sweet spots. For forwards that’s the 80th percentile while for defensemen it’s a shade lower at the 75th percentile. In both cases, the team with more (of just that position) wins 66 percent of the time. Using the two different sweet spots plus adding goaltenders to the mix (80th percentile and above hits 58 percent) gets us to a nice 69 percent success rate for playoff series. (As an aside, I also checked whether it mattered if a team had the better goalie going into the series — it didn’t).
That’s better than what favorites have done over the same time frame suggesting that getting exact win values for players isn’t super important — just count the good players! Kidding aside, a breakdown of when “just count the good players” and “just pick the better team” agree and disagree is where things get even more interesting.
Two-thirds of the time they agree and in those cases the better team with more good players is 90-38 (70.3 percent), just above their average odds of 65 percent.
The other third is split between the times the stronger team has fewer stars and the times where both teams have an even number of stars. What’s interesting is that the times where the stronger team has fewer stars are series that the model would deem very close to begin with. Those series have average odds of 55 percent and only two of 34 series had the favorite north of 60 percent — these were coin flips from the model’s perspective. In those cases, picking the team with more good players was more important than “the better team.” The side with more good players went 22-12, winning 65 percent of the time. On the flip side, there were 33 series where both teams had the same amount of stars, a coin flip from the star count perspective. In those instances, going with the model saw the favorites going 20-13, a 61 percent success rate right in line with expectations.
Better team with more good players? Easy choice.
Better team with fewer good players? Go with more good players.
Better team with the same amount of good players? Go with the better team.
The middle bucket is the most interesting there and brings us back to the strong and weak link argument. How exactly is a team better with fewer high-end players? Depth. And they won 20 percentage points fewer series than expected. We’re only talking 34 series here — but that’s a notable difference. Usually those series were too close to make an informed call anyways and they were usually that close because of the better team’s advantage in depth. That’s not an advantage that ended up actually mattering in the playoffs.
The sweet spots may seem trivial, but in the end, they make sense for hockey reasons.
The 80th percentile for forwards gives us 97 forwards this year.
The 75th percentile for defensemen gives us 58 defenders.
The 80th percentile gives us 10 goalies.
Basically, the sweet spot is how many bona fide first-line forwards and top-pair defenders a team has and whether or not they have an elite goalie. It’s not that different from the Stanley Cup checklist where the criteria is five first-line caliber forwards (plus two more top-six forwards), four top-pairing defensemen, and a top-10 goalie. There are degrees of difference within the checklist that matter, but sometimes it really is as simple as “just have a lot of good players.”
So what does that mean for this year?
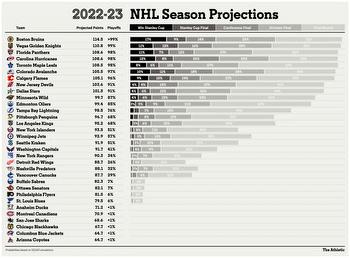
Here’s how many players each potential playoff team has above the sweet spot for each position.
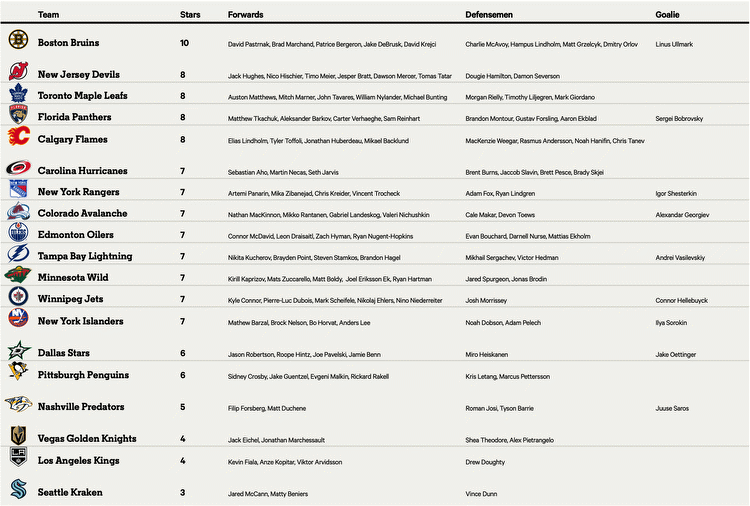
Boston is naturally in a league of its own with 10 star players with Carolina’s losses of Andrei Svechnikov and Max Pacioretty being especially impactful here. The Hurricanes would’ve been second with nine players who make the cut. Instead, they’re in a third tier with seven stars alongside Colorado, Edmonton, Tampa Bay and the Rangers. Not a bad place to be. New Jersey, Toronto and yes the rising Florida Panthers are the teams to watch in the next tier after Boston — a shade above the glut of teams in the six-or-seven range.
Rounding out the bottom of the list are three Pacific powerhouses: Vegas (four), Los Angeles (four) and Seattle (three). All three are teams built off depth, but will they be able to match up to the high-end talent in Edmonton or Colorado out West? According to the research done here, the odds aren’t in their favor though that may change if Los Angeles continues its torrid surge up the standings or Mark Stone comes back for Vegas. In the Kings’ case, both Gabriel Vilardi and Adrian Kempe are right on the cusp. As for Seattle, the team’s depth is unlike anything we’ve seen before; maybe the Kraken will be the exception to the rule.
The most shocking part of the list above is one team in the second tier, the Calgary Flames who look likely to miss the playoffs entirely, partly due to historically cruel luck. But even if they’re a better team than their record, it’s also a testament to the flaws of the perhaps overly simplistic strategy of “just count the good players.” The Flames’ highest-ranked forward is 56th in projected GSVA while their highest-ranked defender is 15th. They may have a lot of top-of-the-lineup talent, but not much in the way of actually elite talent. That’s something that gets undersold with this exercise and why looking at how talented the strongest links actually are still matters.
Hockey is still a chaotically random game, one where the highest seed has only won 54 percent of playoff series since 2010 and where the favored team has only won 63 percent. When the playoffs roll around expect the unexpected.
But that doesn’t mean teams shouldn’t try to tip the scales in their favor. On the contrary. Within that randomness, there is still a trend worth focusing on, one that has shaped the way the league’s best teams are built.
It’s all about the top of the lineup, the difference makers, the stars, the needle movers. At the core of it all it’s about … the core. The teams with the best and deepest cores are the ones that do the most damage come playoff time, not necessarily the best and deepest teams.
Teams can distract from that by plugging holes and creating deep rosters, but at the end of the day, there will always be a question about whether there’s enough oomph at the top to go the distance. And for good reason — it’s those teams that do usually go the farthest.
Hockey may be the ultimate team game where every role, player and role player matters. But within that dynamic, there’s an opposing truth that they only matter as much as the players at the top of the hierarchy dictate.
Even in the playoffs, like it or not, it’s how bright the stars shine that decides who wins and who loses.
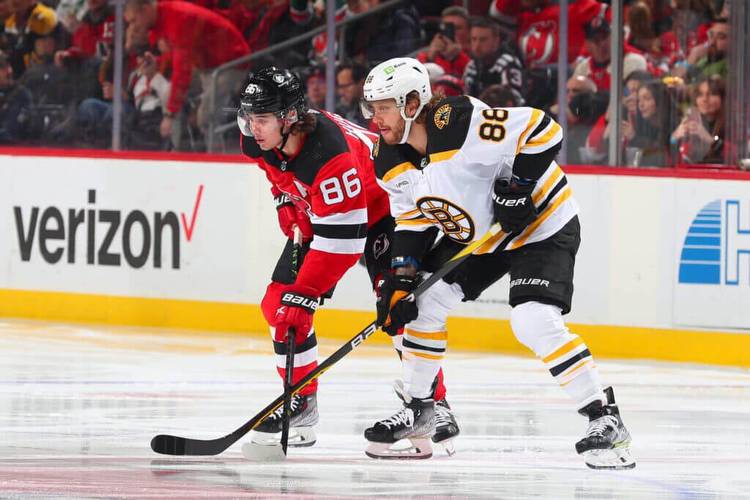
(Top photo of Jack Hughes and David Pastrnak: Rich Graessle / NHLI via Getty Images)