How New MLB Rules Have Affected Early-Season Baseball Betting
With MLB adopting several new rules or tweaks to their existing rules prior to the season, we expected changes to the baseball betting landscape. Halfway through 2023, let's see how those changes have affected the game and betting on it.
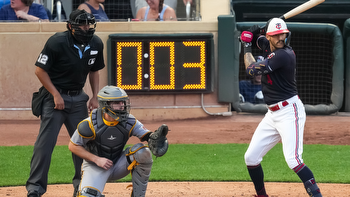
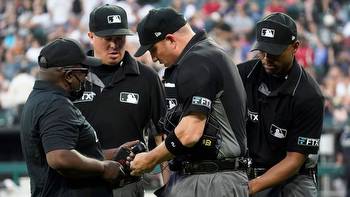
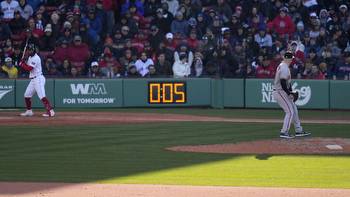
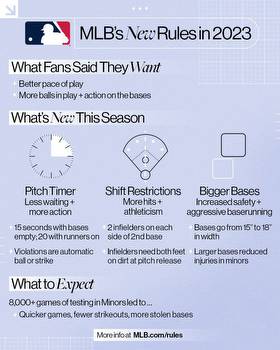
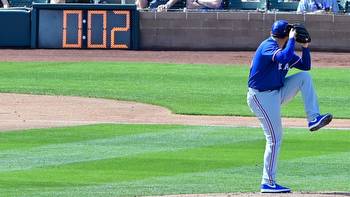
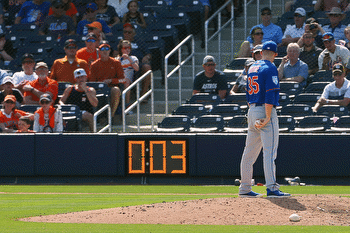
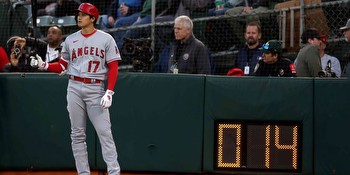
At the beginning of the regular season, I examined how the new rule changes would potentially impact the game as MLB established new measures to speed up the game while also increasing scoring. Some of the major changes I looked at were the pitch clock and pitcher disengagements as well as the bigger bases and the partial ban of the infield shift.
Now 90 games into the 2023 season, it’s time to look at how those rules have affected the game and compare those results with other first-half seasons in terms of runs, balls in play, and stolen bases.
It’s essential to look at the time from late March to the middle of July as not counting for all of July and August would be taking the best hitting months, in terms of weather, out of the analysis.
I’m starting my data from the 2016 season as that was the first big spike in home runs (around 5,600 a season) and will be omitting the 2020 season as it started in July due to the pandemic.
Now there is some variance because of the smaller data set (back to 2016) and the seemingly juiced-ball seasons. Still, a comparison to the previous six first halves will give a good indicator of how the new rule changes have altered the contemporary game.
Balls in play
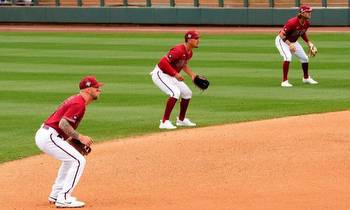
With the new shift rules, I assumed batting averages would be slightly up to coincide with more balls in play and their success rate. I also wouldn’t be surprised to see a decrease in double plays as pull hitters theoretically have a new lease on life this year. However, despite an across-the-board increase in all four stats year-on-year, the numbers are very similar to the six-year averages.
I really thought I’d see some more standout numbers in terms of average, balls in play, and even fewer GIDPs, but I was wrong.
Yes, most of the numbers are higher than last season as a six-point jump in AVG is significant, but this season’s first-half numbers are still not as good as the 2016 and 2017 first halves and those were the first two seasons with 5,000-plus home runs since 2010. There was some swing-and-miss in those seasons.
The rule changes have affected the balls in play, but it looks more like a course correction from the last couple of seasons and not the groundbreaking shift to the game over the last eight years some may have anticipated.
Best MLB bonuses
Looking to bet on some baseball action? Here are two of the best bonuses* available:
B) Get a profit boost up to 100% on one MLB SGP at DraftKings! Opt-in Now
best sportsbook promotions for 2023.
21+. Gambling Problem? Call 1-800-GAMBLER
Runs
Runs per game are up compared to the last three seasons and plus-0.08 runs per game over the averages of the 2016-’22 seasons, but still ranks third over the last eight first halves.
2017 and 2019 are tough numbers to beat in terms of run production but it does seem the new changes have created a scoring environment somewhere just below those years.
Home runs also look the same with the 2019 and 2017 seasons leading the way in home runs per plate appearance. However, the rule changes do look to be creating more RBI opportunities.
With a slight increase in BABIP and batting average, combined with a better stolen-base environment, batters are having more chances at knocking in runs but those two earlier seasons still posted higher numbers.
Scoring isn't even at a five-season high but the slight changes have turned the last two to three seasons of moderate scoring into a more offensive game — just not at the 2017 and 2019 levels.
Compared to last year, each game is seeing a 5.54% increase in combined runs per game with this year seeing an average of 9.14 total runs compared to 8.66 a season ago.
Runs are slightly up this year compared to the six-season average coming into the 2023 season. Home runs are down per plate appearance while RBI/PA increased.
Stolen bases
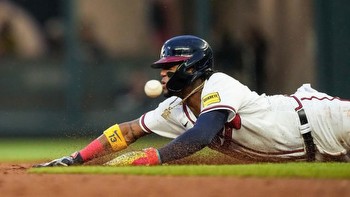
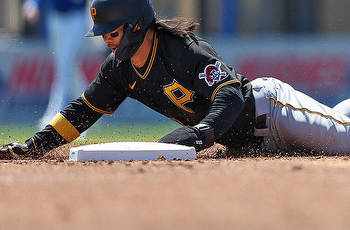
If there’s one stat that's been truly boosted by the implementation of the new rules, it’s the stolen base. Many analysts predicted this heading into 2023 and during Spring Training as swipes were on the rise.
With bigger bases making the basepaths shorter combined with the disengagement rules heavily benefiting the base runners, spring runners attempted 50% more stolen bases this year than in 2022. Those additional swipes kept coming when the regular season got underway.
The increase in stolen bases this season is drastic. Stolen-base attempts are up 30% this year compared to 2022 and the success rate is sitting at nearly 80%. In the history of baseball, the stolen base success rate has never been above 76% for an entire season. And while successful base-stealing has been on the rise over the last decade or more, the new frequency is alarming.
Currently, base-runners are stealing bases at a significantly higher rate — 32% more per plate appearance than the average from 2016 to 2022 (excluding 2020). A stolen base is now just as frequent as a GIDP and it's a market bettors can take advantage of.
Speaking of which...
Applying this to the betting market
Scoring is slightly up this season and bettors could see even more runs scored with the hotter months around the corner. Currently, MLB games are seeing a total of 9.14 total runs per game compared to 8.66 last season. Yet closing totals are 644-653 O/U on the year, giving the Unders a slight 50.3% edge.
It seems books have adjusted to the higher-scoring games, or the betting market is at least more aware and still backing the more public total play.
The best edge lies in the stolen base market, which is tough to price for every type of runner. Bettors can still get Shohei Ohtani at 10/1 to swipe a bag and young players like Drew Waters were paying +1,600 to steal a bag before books (or enough of the public) caught on a moved the line closer to +900.
It’s tough to blindly bet Ronald Acuna Jr. at +120 to steal a bag but even he has stolen a base in 39 of his 89 games (44%), which would still make him profitable to the Over at anything above +130.
Stolen-base betting information isn’t the easiest to find, which likely means less money being bet into the market and creating more inefficiencies. Find teams that love to run (Reds, Rays, A's, Pirates, Diamondbacks, Royals, Guardians, and Brewers) and wait for solid matchups vs. pitchers with poor SB/IP marks that can be found at Swish Analytics. Also, bettors can target poor catchers (ie: Travis d’Arnaud when Sean Murphy DHs or is on the bench).
There are some game script worries with stolen-base betting as teams don’t usually steal when up more than four or five runs, but targeting a high-scoring game with a pair of running teams in a near-pick ‘em is a good way to find some value.
The frequency between a home run and stolen base has never been so close but the stolen base market has much better odds with more inefficiencies in pricing. The books are aware of the increase in SBs, but there are still plenty of daily +EV bets to be made with those props.
The new rules this season have slightly increased scoring, but the real benefactor has been with stolen bases. It’s a market that every bettor should verse themselves in as it can be very profitable with half a season to go.