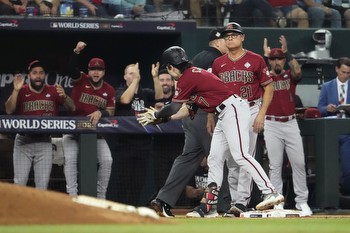
The State of the Diamondbacks: 50 games in
Before the season, Las Vegas set the line at 75⁄2 wins. I said at the time that it “seems almost ludicrously low. If I bet real money on stuff, I’d be all over that.” To finish below that line, the D-backs would now have to go 46-66 or worse the rest of the way, the equivalent of a 97-loss or higher pace over a full season. While nothing is ever guaranteed in baseball, it would require a real meltdown for that to happen. The prediction systems reflect this: while they still don’t buy into the D-backs being a 90-win outfit, they have all moved upwards since Opening Day into winning territory. Fangraphs is at 84 wins; Baseball Prospectus 81.5; FiveThirtyEight 83; Baseball Reference, 84.3.
This is reflected in the playoff odds. From 15.3% on Opening Day, Fangraphs now has Arizona at a better than even shot to make the post-season, at 54% (below). Baseball Reference has always been more bullish, but the increase there has also been around the forty percent mark, improving from 29.2% to 70.4%. Save a brief blip during the curtailed and bizarro 2020 season (when the D-backs were 13-11), it is the highest figure for Arizona since B-R started keeping playoff odds records at the beginning of 2019. This is likely no surprise, as the last time team was eight games over .500 before this road trip was on September 14th 2018.
Offense: 5.14 runs per game
- 2022 season: 4.33 runs per game
- First 50 games of 2022: 3.90 runs per game
Part of the improvement is certainly due to the rule changes encouraging offense. Across MLB, runs per game are up from 4.28 last year to 4.56. But that represents only about one-third of the gain posted by the Diamondbacks this season. Indeed, right now, the team’s OPS+ of 110 is easily the highest in franchise history. The only other time they were above a hundred was back in 1999, when they had a 101 OPS+. Admittedly, Arizona remain a long way behind the Rays, whose 138 would be the highest figure in an active league since the 1876 Cubs. While their BABIP of .309 is a little higher than average (.296), it doesn’t feel excessive for a team built on youth and speed.
Despite recent concerns in this area, it’s worth noting that the team’s production with runners in scoring position is very close to their overall figure. The D-backs’ OPS with RISP is .762, just four points below their overall number of .766. While teams generally do hit better with RISP (this year, by 22 OPS points) I also note that Arizona’s BABIP there is a good bit lower than general, at .281. All things being equal, that should trend up going forward, and lead to better production. Another factor has been the team’s increased aggression on the base-paths. While only 8th in SB, they take an extra-base e.g. going first to third on a single, an MLB-leading 50% of the time, while making fewer than average outs on the basepaths.
Pitching: 4.84 runs per game
- 2022 season: 4.57 runs per game
- First 50 games of 2022: 4.50 runs per game
The increase for the Diamondbacks’ pitching staff is more or less in line with the overall increase across baseball, noted above. But considering how largely underwhelming the 2022 D-backs were on the mound, this has to be considered rather disappointing. The increase has come from the rotation rather than the bullpen. Arizona’s starters currently have a 4.58 ERA, compared to 4.05 last year. However, the now-departed bloat of Madison Bumgarner is a significant factor: take him out, and the rest of the rotation sits at 4.20. I would also expect Brandon Pfaadt’s ERA to come down from its current figure of 7.65 (if he isn’t bumped down to Reno to make way for Zach Davies’s imminent return).
The bullpen has improved at least somewhat, their ERA dropping to 4.40 from 4.58 last year. However, it is worth noting that last year’s bullpen more or less fell apart later on. In August and September 2022, they had an ERA of 5.24. We currently have four pitchers - Miguel Castro, Andrew Chafin, Scott McGough and Kyle Nelson - on pace to appear 75 times or more. Only two teams in baseball history, the 2003 Dodgers and 2009 Braves, have done that. So it feels like something has to give. The problem is they’re close to the only reliable arms. That quartet have a combined ERA of 3.01 across 86.2 innings. Everyone else: 5.69 over 93.1 innings. Maybe the return of Joe Mantiply will help?
Awards standings
Rookie of the Year. Corbin Carroll clearly leads the pack in the race for the National League. Averaging bWAR and fWAR, he sits at 1.75 WAR, a good distance ahead of the current runner-up, James Outman of the Dodgers at 1.10. Steady as he goes, and with good health continuing, he could become the first Arizona winner of the award. I also note that Dominic Fletcher is 7th among position players by both metrics, averaging 0.65 WAR. For some reason, Fangraphs also includes Gabriel Moreno as a rookie, which he is not. But if he were eligible, he’s also be in the top ten, at 0.95 WAR. [As an aside, no rookie pitcher in the NL has currently been worth more than 0.7 WAR by either measure]
Cy Young. The other major area of interest is here, where Zac Gallen has, at the very least, a great chance of improving last year’s fifth-place finish. But there’s a remarkable difference in how he’s seen by bWAR and fWAR. Fangraphs has him the best pitcher in the league, and it’s not close: his 2.8 fWAR is close to a win more than the next best, Spencer Strider’s 2.0. But Baseball Reference doesn’t even rank Gallen in the top ten. He’s all the way down in 13th place, at 1.3 bWAR. That’s not even the biggest gap. Fangraphs has the recently-seen Zack Wheeler at #4. Baseball Reference? #54. The table below has the stats for all players who are ranked in the top 10 by either metric, in descending order of average WAR. All to play for!
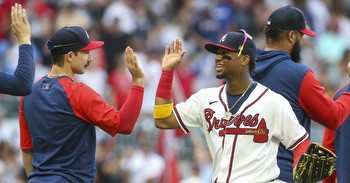
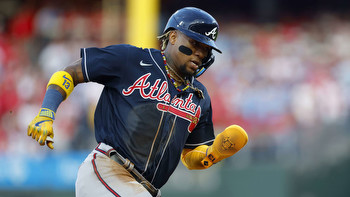
Most valuable player. At the moment, the award would seem to be Ronald Acuña Jr’s to lose. He leads in both bWAR (2.8) and fWAR (2.5). It’d take something quite special for a Diamondback to make it into the top three and become a finalist this year. But if you’d told me before the season started, that as we approach the one-third point, Geraldo Perdomo would be very much in consideration for some down-ballot MVP love... Yeah, I think that’s clear the most unexpected development of the 2023 season to date. Despite having only 130 PA, forty percent less than Acuna, Perdomo sits in the top 10, with 2.1 bWAR and 2.0 fWAR. The only players at 2+ in both are Acuña, Freddie Freeman and Paul Goldschmidt.
bWAR and fWAR are also in agreement as to the D-backs’ top three position players so far. Behind Perdomo, second- and third-place go to Corbin Carroll and Lourdes Gurriell Jr. respectively. After that, things become a little less uniform, with Ketel Marte’s production seen as lower than Christian Walker by Fangraphs, but the other way round on Baseball Reference. Again, the chart below lists all the positive contributors for Arizona by bWAR, ranked in descending order of the bWAR/fWAR average.