How to Create an Odds Line / ‘Tissue’ geegeez.co.uk
In this article I am going to discuss some ideas when it comes to creating your own odds line (betting odds / tissue), writes Dave Renham. As punters we need to take the odds of horses into account when contemplating a bet so 'finding value' is clearly an area of real importance. I wonder, though, what percentage of punters actually produce their own odds lines? I would guess less than 1%.
The modern world seems all about trying to do things quickly, and most punters haven’t got the time or inclination to spend hours and hours creating an odds line or betting tissue for races. Although there is no magic bullet for creating a line, in this article I will look at three basic DIY methods for your consideration, none of which take too much time to produce.
Why create an odds line?
Before delving into some ideas, let me first talk a little about why you may want to create an odds line and why an accurate one is extremely useful.
Making money from horse racing is not about the ratio of winners to losers you get, it is about whether you are able to achieve value prices. If you can achieve value prices on most of your selections you WILL come out in front. I’ve lost count of the number of times friends who have gone to a race meeting, usually on a ‘jolly’, have asked me to give them as many winners as possible. My reply is always the same: ‘if you want the most number of winners, just bet the favourite’. I tell them that favourites are the most likely horse to win so bet them. Of course this is true – they have the best chance of winning in percentage terms. However, I do also tell them that this is not the right way to approach betting in reality and that I am simply answering their question with a percentage-based answer.
So let's explore what ‘value’ is in more detail. Sticking with favourites for the moment, let us imagine over a long period of time we back a hundred identical favourites who all theoretically have the same chance of winning, and are all priced at Even money. According to their betting odds, each horse has a 50% chance of winning their respective race. For you to achieve ‘value’ the true chance of each horse winning needs to in excess of 50%. In reality is more likely to be around 45%.
Let us now imagine that each horse has a true percentage chance of winning of 55%. Over the 100 races, you will win 55 and lose 45, and make a profit of 10p for every £1 bet.
It would be interesting to know how many punters have a good understanding of probability in terms of betting odds. I am lucky that my main profession was as a Maths teacher and hence probability is something I understand well.
I must admit, I am often amused when I hear about certain ‘significant’ market movers. For example you may hear a pundit say, ‘Horse A has halved in priced from 33/1 to 16/1’, which I think gives people the wrong impression. OK, if these two prices reflect the true chance of Horse A winning, then the probability of success has improved from 2.9% to 5.9%. Whilst it is technically correct that the horse has halved in price, the percentages have changed by just 3%, which is not as big a swing as the numbers 33 and 16 perhaps suggest.
Let us imagine another horse, Horse B, whose price has come in from 9/4 to 13/8. On first glance, for some, I would guess that this shortening in price does not appear anywhere near as big as the 33/1 to 16/1 one. However, this second example is actually a much bigger percentage swing, moving from a 30.8% chance of winning (9/4) to 38.1% (13/8) - a difference of 7.3%. So understanding the percentages when it comes to betting prices is important.
When to use a ’tissue’
Before I look at some different ideas regarding creating tissues, or odds lines, I want to suggest what type of races you might start with. I think it is best to look at races where most of the runners are 'exposed' – in other words, they have plenty of form in the book. I would probably avoid Group races and low grade handicaps, however, and look for something in between – maybe class 2, 3 or 4 handicaps. Also I would personally focus on races with smallish fields for the first few races – around 7 to 9 runners seems a sensible option - in order to manage the time aspect of creating a tissue. Ok, let’s look at method 1.
Method 1. The ABCD method
This is a very simplistic idea but is a potential starting point if trying this for the first time. I would grade each runner depending on what I felt in terms of their general chance of winning, where:
A – very strong chance
B – good chance
C – worth considering
D – unlikely, but cannot dismiss
E – poor chance
F – virtually no chance
How you assess each horse to arrive at your ranking is totally up to you. I personally would look at a combination of factors using some, or all, of the following:
i) form, both recent and long term
ii) fitness
iii) trainer/stable form – recent and course form
iv) the draw in flat races
v) potential run style if known
vi) starting prices of most recent starts
vii) speed ratings
Of course this is not a definitive list, there are other factors you may wish to consider; essentially it is up to you.
Having graded the horses I would then try and assign a rough percentage chance of them winning. Let us imagine a 7 runner race where we have the following grades:
From here I would add up all the percentages and here they total 103%. Ideally I would like them to add up to 100% to give me a ‘perfect’ book, but 103% is perfectly acceptable. If your percentages are further away from 100%, massage the 'percentage chance' figures until they fit.
From here I would assign the closest betting price to each percentage. Some percentages such as 25% have an exact betting price of 3/1; others, like 15%, have not, but the closest price to that is 11/2 (which equates to 15.4% chance). Here is my grid with the prices added and the percentage chance rounded:
The overall percentage book has edged up slightly to 103.9%, but this still pretty good.
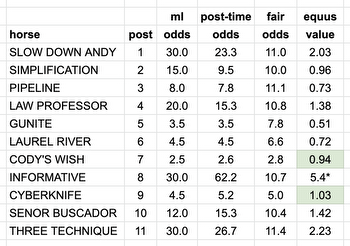
From here I would simply look at the best prices available across all bookmakers, and/or check the Betfair market. The Betfair market and most odds comparison sites (including the geegeez cards 'odds' tab - see image) give you the book percentage for the race so you can see how close that is to your book percentage.
The book percentages should be similar to yours, within a few percentage points at least. Betfair Exchange will always have a figure closer to 100% than the best bookie prices.
If you prefer to work with odds and then convert those to percentages, the 'My Ratings' icon will enable you to do this. Click the icon in the menu bar to open the ratings boxes for all runners, and then simply add odds to each runner. You'll see the percentages calculated for you, both for the individual runner and for the race overall:
At this point you need to compare the actual prices on offer with your own prices. We are looking for the positive outliers - horses that are priced higher in the real betting market when comparing them with your prices. Let us imagine in our example above that Horse C is best priced with the bookies at 9/1 (10.0) which equates to a percentage chance of winning of 10%. This gives us an ‘edge’ of around 5% assuming that our price is accurate! If our price is an accurate representation of the true percentage chance of the horse in question, then we have a value bet.
Method 2. Simple Rating Method
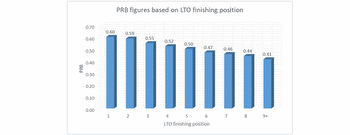
The second idea I want to look at is a basic rating idea. Once more I’ll assume we have a 7 runner race with exposed horses. Look at each of the horses in the race and their finishing position last time out. I would then look at the long term data in relation to that finishing position when racing in similar 7 runner races. For example, last time out winners win roughly 22% of the time in these races, horses that finished 5 last time win around 12%, etc. From here I halve each percentage and assign that as a rating figure to each horse.
Then I would look at four or five different factors (such as those I shared earlier in the ABCD method above), giving each horse either a positive, neutral or negative mark. For positives I would add two points to their total, neutral marks I would leave the rating as it is, for negatives I would subtract two. One of these factors could be, for example, last time out starting price. If a horse started at 3/1 last time, say, this would count as a positive and gain a ‘+2’. If another horse started at 25/1 on its prior run then I would give that a ‘-2’.
Once you’ve done this across all factors / variables you will have ‘rating’ totals for each horse such as below:
From here you can add up the final rating totals which in this case equals 62. Then divide the rating for each horse by 62 and multiply by 100 to give them a percentage chance. In this example we get the following:
With the percentages of the seven horses adding up to 100% we have a perfect betting book. From here we would change these percentages into betting odds in the same way as before. If you are unsure how to convert percentages into odds, then there are odds calculators that you can google and use; or enter the odds into the geegeez ratings boxes like in the image above.
Once we have our odds, as previously, we would cross check our prices against the actual odds on offer looking for any horse that offers ‘value’.
Method 3. Using a ‘benchmark’ horse or horses
This is the method I used for these types of races when I was writing Spotlight for the Racing Post many moons ago. Interestingly, Andrew Mount, who co-wrote a draw bias book with me 20 years ago and also worked as a Spotlight writer for many years, used the same idea in certain races for more exposed runners.
The ‘benchmark’ horse is basically the horse which you think is the easiest to accurately price up / give a percentage chance of winning. Each race will of course be slightly different and hence each ‘benchmark’ horse is likely to fit a slightly different profile. The types of horses I’d be looking for are either:
- a horse that stands out on form – in other words the horse you believe should start favourite. The potential price of your favourite will depend on your perceived chance of the horse winning. If you thought the horse was likely to win this type of race one in every three starts you would price the horse at 2/1 (3.0); if you thought it was likely to win the race one in two you’d price it up at Evens (2.0), etc.
- a horse with a consistent recent record; hopefully one with solid form figures over the last three or four races. Ideally this horse would have gone off at similar prices too in these races. So if we say had a horse that had finished 4, 2 and 3 in their last three runs, starting at prices of between 3-1 and 5-1, then you would probably could price the horse up at around the 4-1 mark.
Once you have a price for your ‘benchmark’ horse you can build the prices of other horses around it. Horses you think that have a better chance than your ‘benchmark’ will be put in at a shorter price, those with a worse chance in your opinion will be priced higher. You may find that two or more horses in a race have either profile 1 or 2 mentioned above, which will speed up the process slightly. Naturally, you can use the odds boxes behind the My Ratings icon on geegeez racecards to help you price up.
Once you have priced up the other horses around your ‘benchmark’ horse(s), then you will need to see what the percentage book for the race equals and it may need some slight adjustment of prices up or down. Once you have a book close to 100% then you can compare prices with the best prices on offer as we did for the previous two methods.
**
For those of you who have not attempted to create odds lines before, I hope these ideas make the task feel less daunting. Of course, using any of the three methods suggested does not mean you will be getting that much needed value race in, race out. It is going to essentially depend on how accurate your odds line is. The only way to find out how accurate it is, is by choosing a method, either one of the above, or a method of your own, and testing it out. One indication that you have a sound method is if your prices generally ‘mirror’ the actual market. If they don’t and, say, you price up horses at 2/1 that are regularly available at 5/1 in the real world, then you need to go back to square one and figure out why the disparity.
If the prices you create generally look reasonable compared to the actual prices on offer then I would suggest pinpointing those horses that look good value when comparing your odds with those of the bookmakers. Paper test these value selections with imaginary £1 stakes and see what happens over a series of ‘bets’. If you are in profit by the end of your testing phase then there are hopeful signs that your odds line is pretty accurate.
How many of these imaginary £1 bets you should work through during the testing phase is not easy to say, but I personally think you need to have at least 200 to give the test some validity. Of course, you could also look for horses that seem poor value and see how they performed as well. All of this will give you a decent overall picture of the effectiveness of your tissue making skills. Once you are happy with your method, then I would suggest looking at races with bigger fields but still races where the horses are exposed.
One final point to note is that I would look at a race as early as possible. With 48 hour declarations you can price up the race before the bookmakers and give yourself plenty of time. Also pricing it up early avoids you being influenced by early odds or the Racing Post forecast prices.
I would not advocate the same method for every single race – for example you cannot use any of the above ideas with a 2yo race with little or no form. Perhaps in the future I will revisit this topic and look at how you may try to create odds lines in other races such as these. For now, though, I hope this article has encouraged you to look into creating your own odds lines – even if you do not find the holy grail, the process you go through will, I am sure, be useful and enlightening for your overall betting / value understanding.