How To Create Simple Horse Racing Ratings: Example geegeez.co.uk
In my previous article I went through some basic ideas in terms of trying to create your own odds line or betting tissue, writes Dave Renham. In this piece I am going to show you how to go about trying to create a rating method in order to help you when analysing a race. There is no perfect way to rate a race; there are no perfect ratings, so this idea / method I am sharing is just one of thousands of potential ways to rate a horse race.
Two problems in the past I have found with rating a race have been firstly which factors to use, and secondly what ‘weighting’ or importance do I give to each one. Let’s look at factors first:
Factors / variables to use – to start with, one important thing to be aware of is to make sure the factors you ‘rate’ do not overlap in any way. A simple example of this would be using ‘last time out (LTO) finishing position’ but using ‘LTO beaten distance’ as well. These two factors are very similar as they are both measuring last time out performance and they should not be used in combination in terms of rating races; rather, choose one or the other.
For me I do not want to over complicate things so I would be looking for a handful of factors/variables to use in my ratings. Here are the factors I tend to concentrate on when trying to develop a rating system, and what ‘measure’ I would use:
- Most Recent form – either LTO finishing position or LTO distance beaten
- Recent market data – LTO price or prices from last 2-3 runs
- Long term form – some stat connected with the horses’ overall career
- Fitness – days since their last race
- Draw – past C&D draw stats split into thirds
Weighting of factors/variables – this is tricky in my opinion, and I have no magic bullet to share with you I’m afraid. What I have struggled with in the past is which stats to use for each factor – win strike rate, placed strike rate, A/E indices, etc. Not only that, but how on earth do you ‘weight’, for example, LTO position versus days since last run? How do the individual LTO finishing positions compare with a grouping of days since the horse ran last? What grouping for days since last run do I use? I cannot use individual days, so do I group it in weeks, blocks of 10 days, etc?
There are lots of questions, but no clear cut answers. Suffice to say, you just have to go with your gut instinct in terms of weighting factors. Once you have rated a few races, you will get a feel for what you may have to adjust to improve them.
For this article I will be using the five variables mentioned above in an attempt to create simple ratings for horse races. As far as weighting is concerned, I am basically going to weight each factor in a similar way. In order to do this, my stat of choice is going to be the PRB stat (Percentage of Rivals Beaten).
Percentage of rivals beaten (PRB) – Before becoming a member of the Geegeez family I had not really delved into this metric much. However, now, I think it is arguably the most important racing stat I consider. For more information on PRB (and the other metrics used on geegeez.co.uk) .
On Geegeez you can find the PRB stat in a variety of areas which can be accessed from the racecard – individual horse records such as:
On the Profiler tab:
In the pace / run style tab:
And in the draw tab:
Hence, we can find the draw PRB stats needed for my simple rating method on Geegeez. For the remaining stats we need to make use of several hours of number crunching I did prior to writing this article.
How is this simple rating system going to work?
Essentially, I am going to use the five factors mentioned earlier and find the relevant PRB figures for each horse within each factor. Then I am going to add up the five PRB scores to give me their final scores or rating. I said it was simple! I would suggest trying this idea in handicap races; I would use a different idea for say 2yo races or 3yo maiden races.
Right, let’s go through each factor one by one:
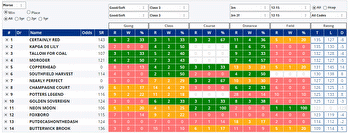
- Draw – I would like to start with one of the tabs you can use on Geegeez. Let us imagine we have a 1m handicap at Pontefract with 9 runners. I would actually go to the Draw Analyser tool rather the draw tab in the racecard in order to use a more precise date range. Hence this is what I would enter in terms of parameters:
As you can see, I have chosen a recent date range (2016 to 2023); handicaps only due to it being a handicap, 7 to 11 runners (+ or -2 from 9 runners), full ‘going’ range from hard to heavy, and ‘Actual’ rather than ‘Card’ as this takes non-runners into account.
In this imaginary 9-runner handicap example, any horse drawn 1 to 3 would get a ‘0.60’ PRB ‘rating’ figure, those drawn 4 to 6 would get ‘0.48’ and draws 7 to 9 the figure would be ‘0.42’.
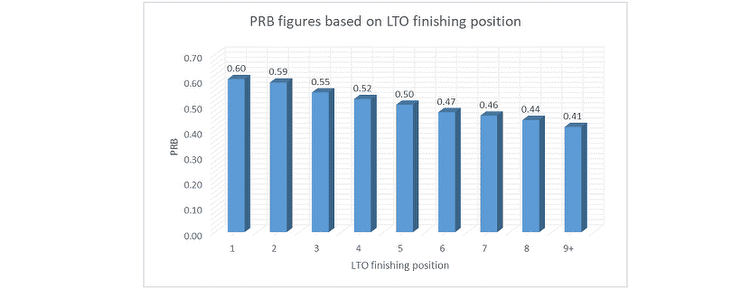
- Most Recent form – for this factor I am going to use LTO finishing position. For the PRB figures I have looked at thousands of handicap races to give the most accurate readings. Here are the PRB figures for LTO finishing position:
As you can see LTO winners have a PRB figure of 0.60 when running in their next race; compare this with horses that finished 9 or worse LTO whose figure is much lower, not surprisingly, at just 0.41.
Therefore, when rating each horse you simply need to look for their LTO finishing position and assign the relevant figure from this graph.
- Recent Market data – for this factor I am going to use LTO price – so the price the horse was in its most recent race. Here are the PRB figures, again taken from thousands of races:
Another sliding scale here as you would expect with shorter priced runners LTO producing higher PRB figures. Hence a horse that was priced 11/2 LTO would be assigned a rating figure of 0.55, if they were priced 25/1 LTO their figure would be 0.44, etc.
- Long term form – for long term form I am going to use career placed percentages in handicap races. The data shared again is taken from thousands of races to give us the most accurate figures possible. I have split the percentages into four groups as the graph below shows:
The beauty of this stat from a Geegeez perspective is that you can find these percentages by using the ‘Instant Expert’ tab from the racecard. All you need to do is to adjust the distance tab (top left of screenshot) to include all races (I use the full range from 5f to 4m4f), click the handicap tab (top right of screenshot), and for ALL flat races click the ‘Flat & AW’.
In the above example, the horse at the top has a career placed percentage of 43% and as this lies between the ’36 to 50%’ grouping, this horse would be worth a PRB figure of 0.54.
- Fitness – for this metric I am using days since last run (DSLR) with once more thousands of races analysed to create accurate PRB figures. Here are the splits:
As you can see this metric is going to be quite even for most horses, as the vast majority of runners will have been off the track for between 8 and 70 days. The 8 to 14, 15 to 28, 29 to 42 and 43 to 70 groupings are very close together in terms of PRB figures.
And that’s it for configuring my factors. Hopefully it has been fairly self-explanatory.
However, let me give you a fictitious example which hopefully will help. I will stick to the 9-runner mile handicap race at Pontefract that I used for the draw data earlier.
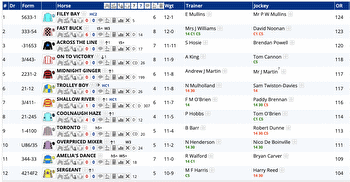
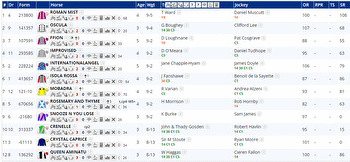
Firstly here are our imaginary horses and their relevant stats:
From here we can convert these into the relevant PRB figures for each individual stat:
I have totalled up the five PRB figures for each horse to give them a final total (furthest column on the right). These totals are their final rating figures and I have ordered our imaginary horses highest to lowest below:
From these ratings, you would hope there is good chance that the winner will come from one of the top three (Fireball, Frazzle and Dobbin); likewise you would hope the bottom three rated (Monty, The Closer and The Gooner) are unlikely to produce the winner.
How you deploy your ratings is going to be different for each individual. You may want to use them as a basis for an odds line – in a 9-runner race, each horse theoretically has an 8/1 chance of winning so you could initially price up the middle rated horse at 8/1. This horse is Plodder – from here you could assign the rest of the prices using Plodder as your starting point, and then adjust them to get a book percentage of close to 100%. Once done you could compare them to the actual prices on offer to see if there are any horses that potentially offer you value.
An alternative approach is to simply compare the actual market position with your rating positions. Let’s say for argument’s sake Dobbin, your third rated horse, is priced up at 10/1 and is 6th in the betting, you might perceive this to offer value. Likewise if the top rated horse Fireball is third in the betting priced 5/1, again you might perceive this horse to offer you some value.
Essentially how you interpret the ratings is going to be personal to you – again there is no right or wrong way. What ultimately matters is how predictive your ratings are. I have not back tested this rating idea as yet, but it is on my ‘to do list’, as I have enjoyed researching and writing this piece. What is likely with a first ratings attempt is that I will need to make some adjustments – for this idea it may be that I am underrating one particular factor and overrating another. If that proves to be the case, I could apply some multipliers to the relevant PRB figures to help with that adjustment. For example, I may need to multiply the underrated PRB figures by 1.10 and the overrated ones by 0.90 to give more accurate overall ratings. However, that is for another time.